-
3-minute read
-
7th August 2016
Using Tables and Charts in Microsoft Word
Using tables and charts can make a huge difference in an academic essay, helping to communicate vital information while also making your work more visually striking. In order to do this, you first have to know how to use the relevant functions in Microsoft Word.
Adding Tables
In Microsoft Word, a table is a grid of empty cells to which you can add information. To add a table to a document, you have three main options:
- Go to the ‘Insert’ tab and select ‘Table’ to open a dropdown menu, then pick the number of columns and rows required from the grid displayed

- Click on ‘Table’ in the ‘Insert’ tab and select ‘Insert Table’, then choose the number of columns and rows required in the new window

- In the dropdown ‘Table’ menu, select ‘Draw Table’ to draw and edit tables with the mouse cursor
You can then add information, such as the data from an experiment, as required. Editing or formatting an existing table simply involves selecting it and clicking on the ‘Table Tools’ section that appears on the main ribbon at the top of the screen.
Adding Charts
Adding a chart, usually a graph of some kind, can be a little more complicated, since your options depend on the type of chart you choose. The basic process, however, is fairly simple:
Find this useful?
Subscribe to our newsletter and get writing tips from our editors straight to your inbox.
Subscribe to Beyond the Margins and get your monthly fix of editorial strategy, workflow tips, and real-world examples from content leaders.
- Go to the ‘Insert’ tab and click ‘Chart’ in the ‘Illustrations’ section

- Choose a chart type that suits your requirements (e.g. bar graph, pie chart, etc.)
- In the spreadsheet window that opens (titled ‘Chart in Microsoft Word’), edit the values and labels to reflect your data

- Edit the chart’s title by double-clicking and typing
This will give you a different way of presenting data and analysis, complementing the text of your essay. Charts can be customised further via the buttons that appear when you click them in the document. You can even link a chart to a Microsoft Excel spreadsheet, if required.
Using Captions
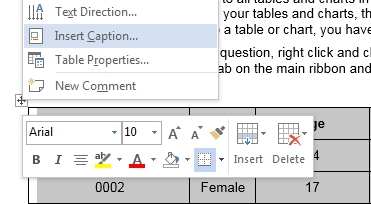
Ideally, you should add captions to all tables and charts in your document. As well as providing a clear, consistent way of labelling your tables and charts, this enables use of MS Word’s ‘dynamic list’ function. To add a caption to a table or chart, you have two options:
- Select the table/chart in question, right click and choose ‘Insert Caption…’

- Go to the ‘References’ tab on the main ribbon and select ‘Insert Caption’
Next, choose a label (‘Table’ for tables or ‘Figure’ for charts and images), type in a title for the chart/table, and click ‘OK’ to add a caption. These captions are then used if you choose the ‘Insert a Table of Figures’ option to create a list of the tables and charts in your document.