-
3-minute read
-
3rd February 2017
Adding Lists of Charts and Figures in Microsoft Word
If you are using charts, tables or figures in an essay, it’s a good idea to list them somewhere in the document. Luckily, Microsoft Word makes doing this simple.
Why List Charts and Figures?
In a short essay with only a few charts or figures, it might not be necessary to provide a list. But in a longer thesis or dissertation, listing charts and figures will help your reader find relevant information quickly (much like a contents page).
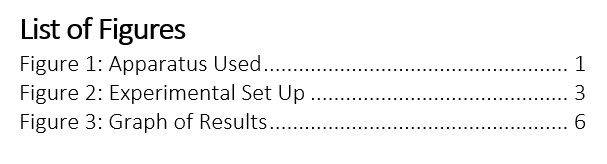
Lists of charts and figures usually appear at the start of a document, just after the contents. You may also want to use separate lists for tables, charts and figures, especially if there are several of each in your work.
Adding Captions
The first step in creating a list of charts or figures is adding captions to your document. In Word, this is done by right-clicking on each image or chart and selecting ‘Insert Caption’ from the contextual menu.
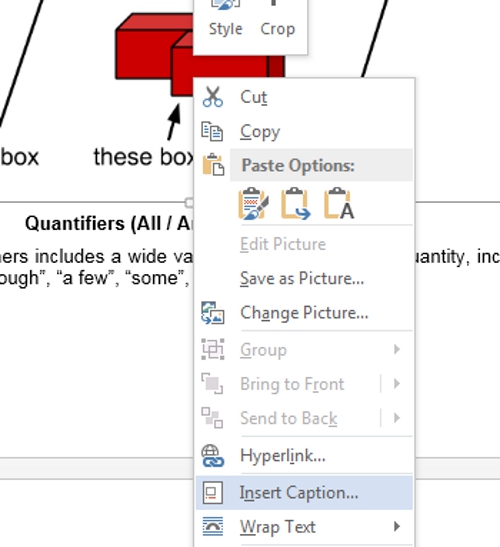
Alternatively, you can add captions via the ‘Captions’ section of the ‘References’ tab on the main ribbon. On Mac computers, captions are accessed via the ‘Insert’ menu.
Remember to pick a label type for each caption. If you want to list figures, charts and tables separately, you’ll need to apply a different label for each.
Find this useful?
Subscribe to our newsletter and get writing tips from our editors straight to your inbox.
Subscribe to Beyond the Margins and get your monthly fix of editorial strategy, workflow tips, and real-world examples from content leaders.
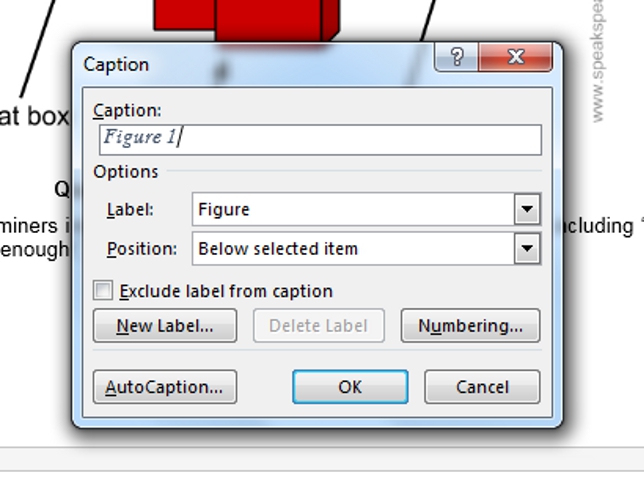
The default labels in Microsoft Word are ‘Figure’, ‘Table’ and ‘Equation’. You can also create custom labels via the ‘New Label’ button in the window that opens when you insert a caption.
Creating Dynamic Lists
Now comes the clever bit. Microsoft Word can use the captions you’ve added to automatically generate lists of figures and charts. To do this on the PC:
- Select where you want the list to appear with the cursor
- Go to ‘References’ on the main ribbon
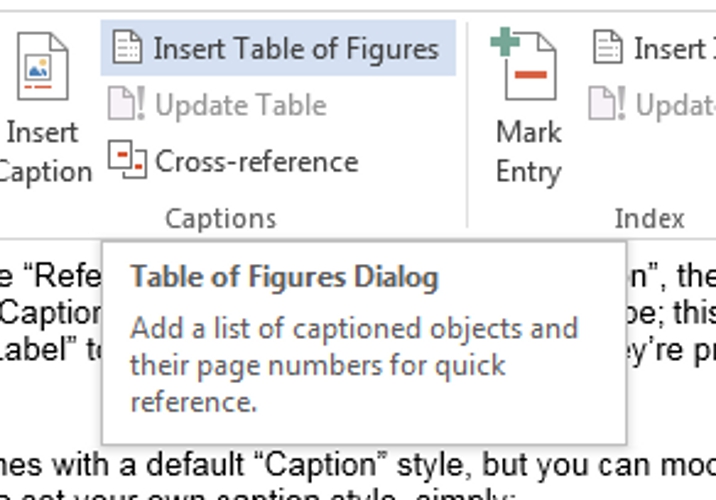
Inserting a table of figures. - Click ‘Insert Table of Figures’ in the ‘Captions’ section
- Select a label type and click ‘OK’
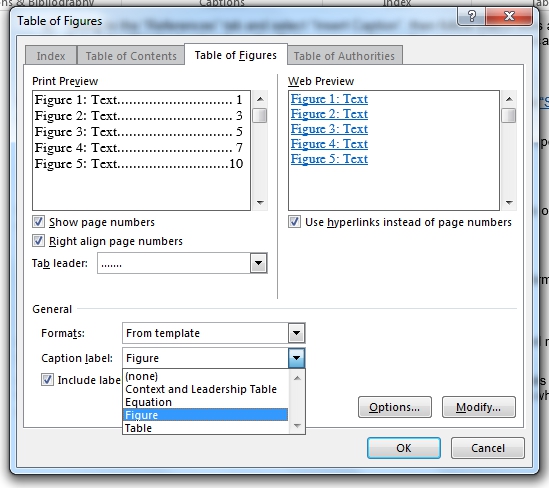
Selecting a label type.
This will add a list of elements with the matching label type, using the caption text as the title of each figure or chart. On the Mac, this is done by selecting ‘Table of Figures’ under the ‘Index and Tables’ section of the ‘Insert’ menu.
To update a table of figures, charts or tables, you can either:
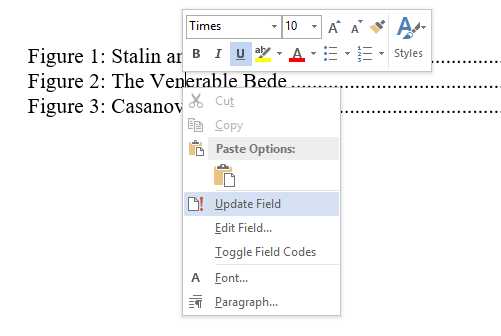
- Right-click on the list and select ‘Update Field’ from the menu (hold down ‘Control’ and click to open the menu on Mac computers)
Updating a list. - Select the list and click ‘Update Table’ under ‘Captions’ in the ‘References’ tab
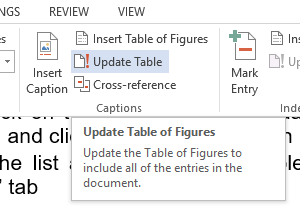
The caption tab.
Updating the table will integrate any changes you’ve made to captions or new captions added since the list was created, ensuring that it remains accurate.